MapPoint 2004
![]()
![]()
![]()

|
MapPoint 2004
|
|
Data Analysis 122 Amazon
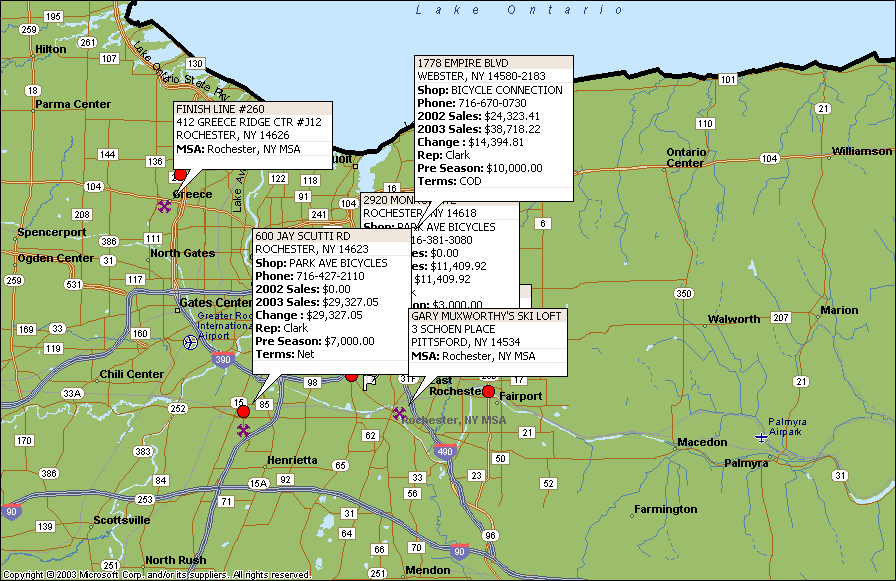
| Below is a series of maps that are the product of MapPoint 2004. Your data can be plotted out with demographics and other (compatible competitors?) Information to identify targets and market situations. With MapPoint you can actively zoom into and out from your target areas and you can export to Excel these sub groups of information. Please scroll through these maps and see if they tell a story that you would like to know for your product and market.
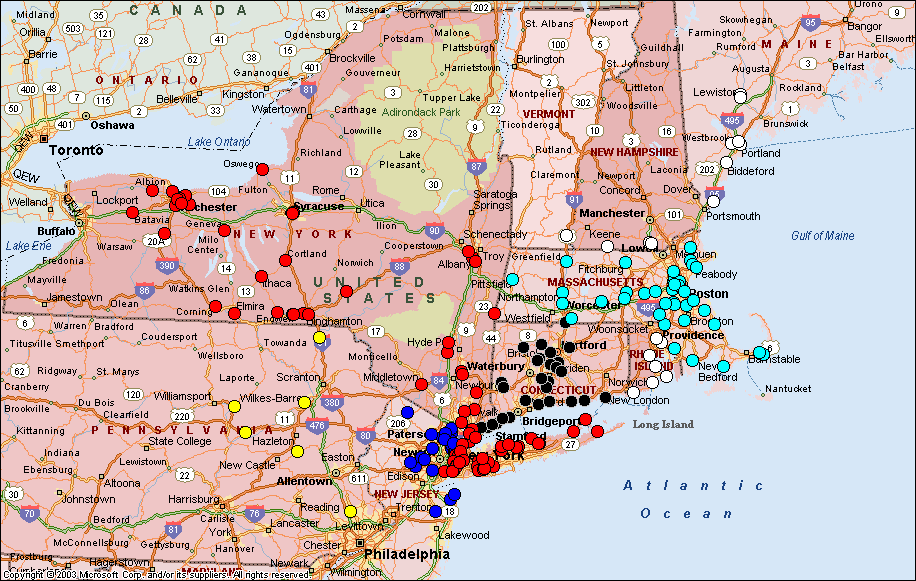
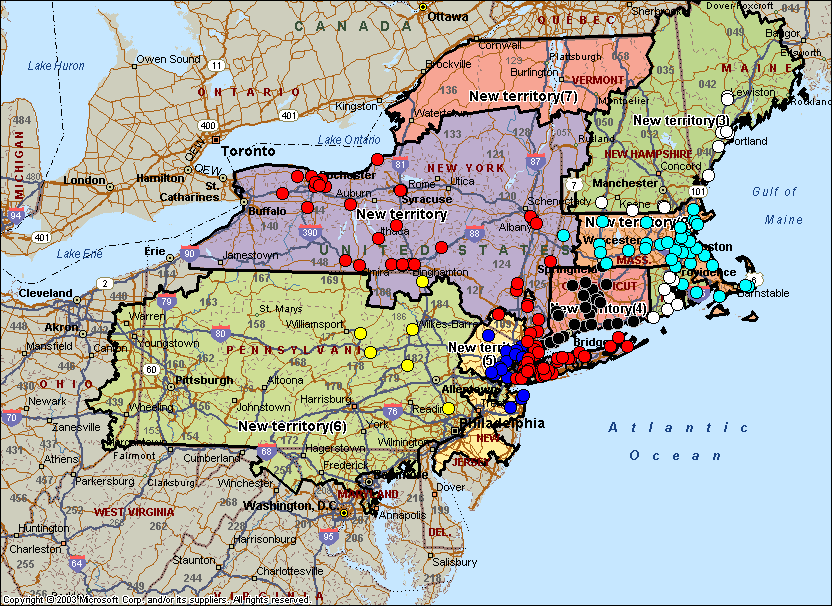
The above map locates a customer list by sales rep. The below map shows sales territories defined by the location of the dealer base. These can be defined by most political borders to Zip code level including county, MSA, and 3 number zip codes.
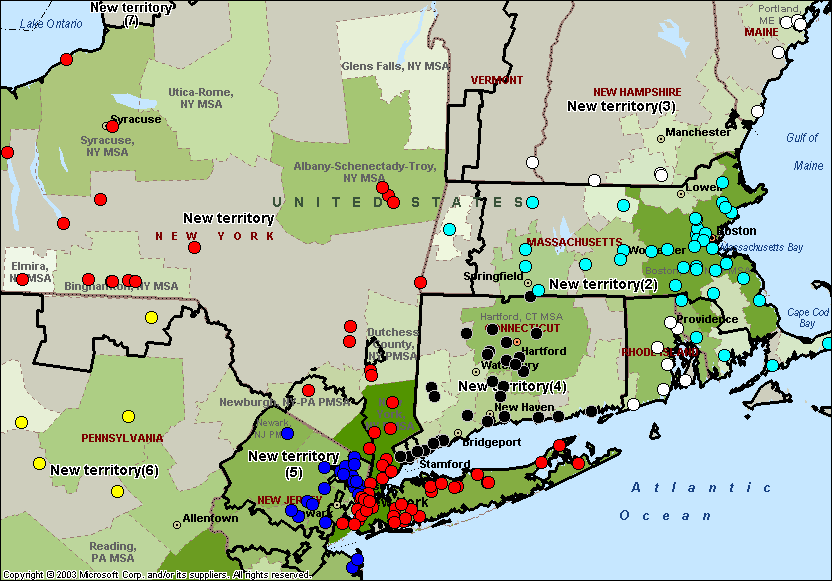
Below is the same map with the territories outlined and also the Metropolitan Statistical Areas visible with physical borders. With the MSA's you can find out demographic details like household count, population, and average income level to determine penetration when company sales are also mapped out and defined within physical borders.
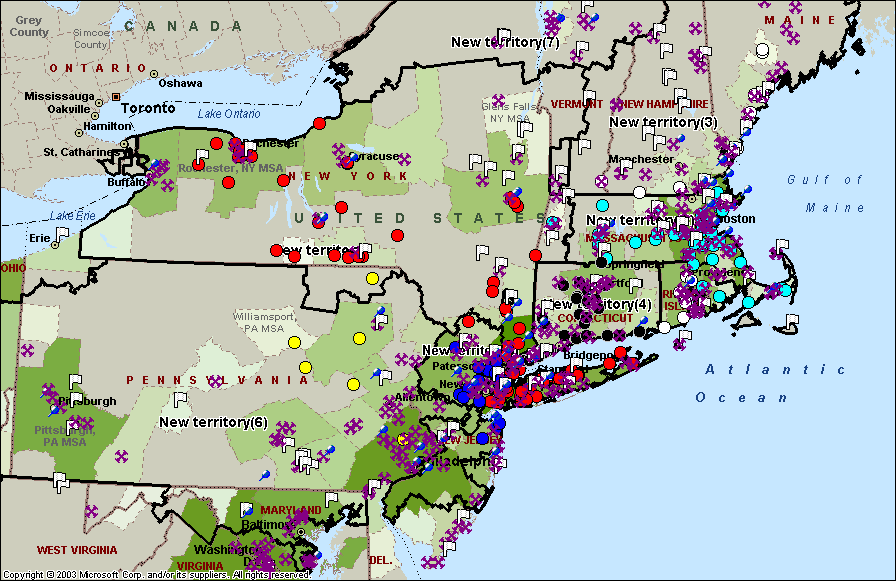
Here is yet another map but with new data positions at the street level indicating competitors or targets in white flags, Blue push pins, or Purple "X"s.
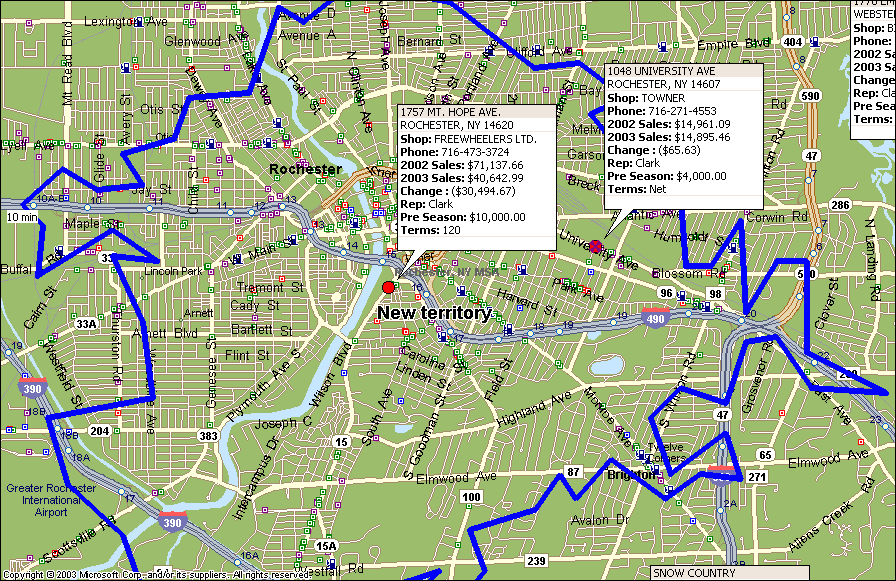
Below is a map with a 10 minute drive time line drawn out from 1757 Mt. Hope
Information can be exported into sub groups and this includes demographic data for the target markets. Combining the sales result data with demographic details can arrive at penetration of market numbers for comparison over time and easier decisions.
The real power of this type of information display is it's integration into Excel and the power this brings to the data. Imagine drawing an area on a map and exporting only that information for your review and consideration! Grouping this data into metropolitan Statistical Areas will bring immediate borders and limits to the information and result in quicker analysis and solutions.
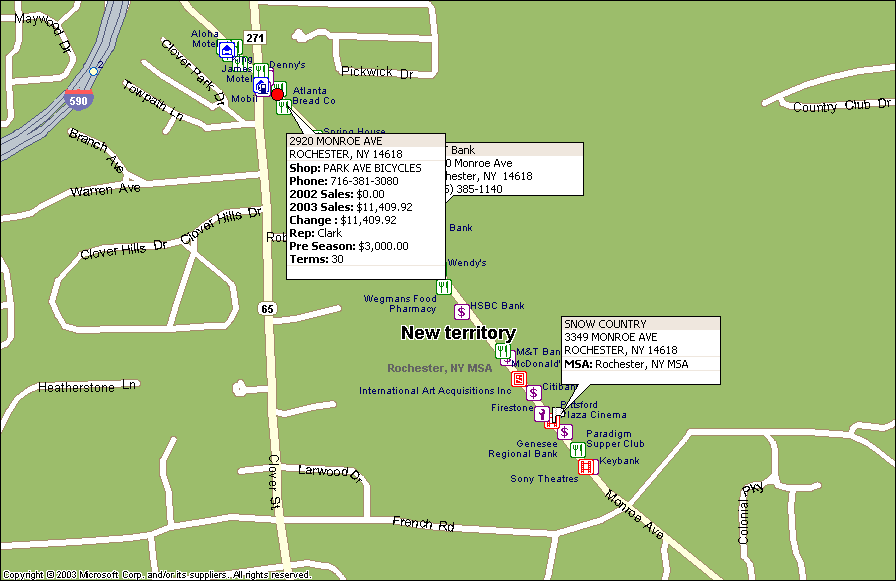
Below is the map of the detail including landmarks and points of reference
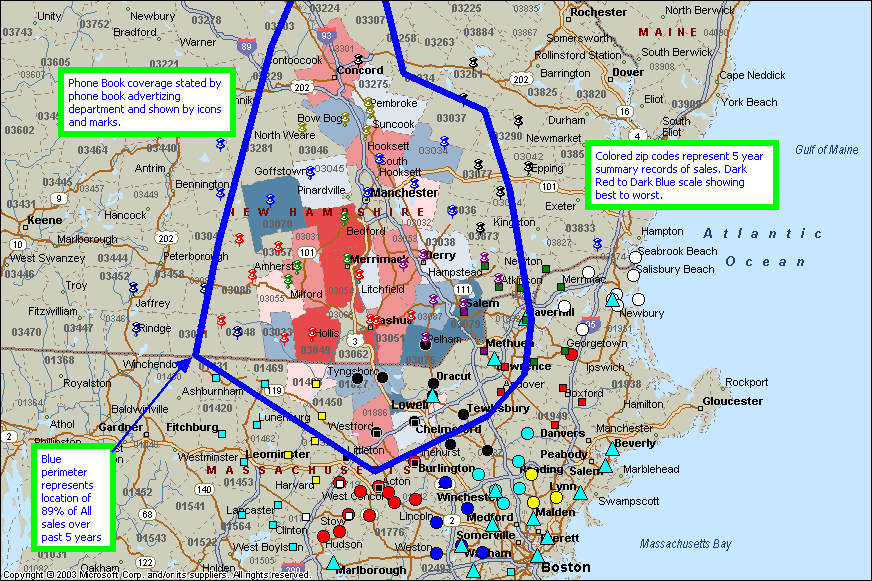
Above is a study of retail sales with the desired outcome of finding out where sales are coming from. By this visual representation of sales and adding phone book coverage...this customer was able to reduce advertising expenditures in phone books by seeing where the Phone books were placed and also where his sales were coming from. Result was a 45% reduction in phone ad expense.
|